2 min. read
Picture Credits: Pixabay
Earlier, we explored focal lengths through the use of Exiftool and R.
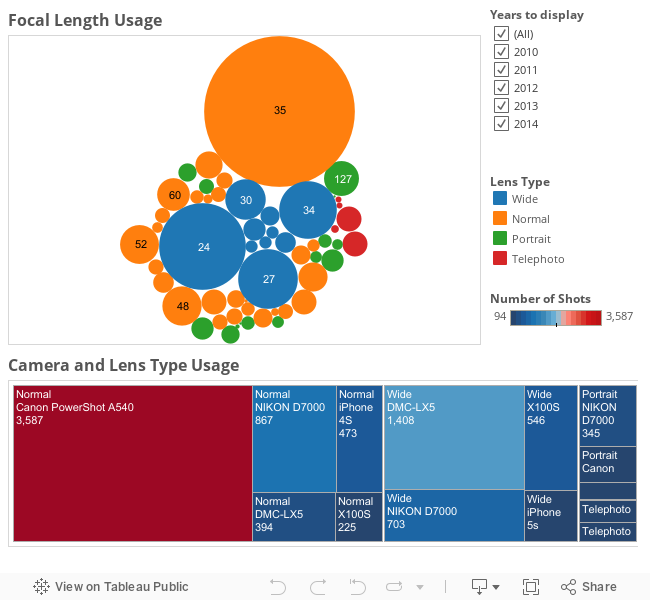
Now, suppose we want to view our shooting styles via focal length usage in the past 5 years, particularly, we want to be able to view how our shooting styles change on a year-by-year basis as well as to view our shooting styles for some range of years, say from 2012 to 2014.
In addition, we are also interested in the combination of camera and lens type usage, which can be exemplified by this question “Do I shoot more (or prefer shooting) portraits with DSLRs or Mirrorless Cameras?” and we would also like to have a year-by-year view as well. So how do we do that here?
In this post, we shall visualize the data from this alternative perspective using Tableau. Please note that this post does not cover detailed steps.
As always, we would need to get our hands on the data provided in the photos – the EXIF data. This data can be extracted using the Exiftool introduced earlier.
We can then load the data into Tableau and explore the data! A point to note would be that the data extracted by Exiftool would need some cleaning, which was taken care of using R in the earlier article. Otherwise, you can follow some tips provided by Tableau here. While this is for Excel files, please note that we can also open CSV files in Excel and apply the steps recommended.
We will be using the packed bubbles and treemaps visualizations in Tableau. This post will not cover the detailed steps to create the visualizations. Enjoy playing the the visualization below!